Always buy cheaper than market - Not clickbait
TLDR - Buy stocks, ETFs cheaper than current market price, if you have the patience for it and if you are in it for the long term.
With a title like that, I better deliver. I have been buying and selling (not much selling these days) for the last 15+ years. I have seen the post 9/11 recovery, 2008/09 subprime crash and post crash bull cycle. I have always wondered if there is a way to beat the market even by a little, just maybe a few percentage points if possible and with the magic of compounding things will start to add up.
Let us use a stock or index as an example. I will use Reliance NIFTY JUNIOR BeES ETF as a reference for this discussion. This ETF tracks NIFTY NEXT 50 index, or in simple terms the 51st to 100th largest companies by market capitalisation listed in NSE.
Here is a price chart of the fund from Jan 2017 to Oct 2018.

Source: moneycontrol
So what is so dramatic about this chart, you may ask. Nothing really and that is the point. The price ran up from Jan 2017 to Jan 2018 and then we have a series of ups and downs ending with the big correction in September / October 2018. This is probably the case for most indexes during this period.
But what is interesting to note is that even during the bull run the price does not go up in a straight line. It is not a linear growth across the time period, but rather it goes up and down within each day, week, month and year. So the question is, can we take advantage of these ups and downs?
Here is how
Step 1:
Determine the entry price. So given that most stocks don’t move in a linear direction, how do I determine the entry price.
If you are savvy and your technical analysis chops are good, then use that to determine the entry price.
If you are like me, just use SMA - Simple Moving Average to determine the entry price of the stock.
If you don’t even want to go there, just check the volatility of the stock for the last 6 months and determine the price movement range (say for example -5 % to + 5% in a month) and use that as an entry price
If even that is too much work, just use the current price and place an order at 2 to 5% discount to current market price.
Step 2:
My trading platform (not of choice, but by necessity) is icicidirect. But one feature of the website that I like is something called a VTC order - Valid Till Cancel. So I can place an order against a stock or ETF based on a target price for a period of up to 45 days. So if the order price is not met on day 1, ICICI will place the order again for the next day for my target price until the date of cancellation or expiry.
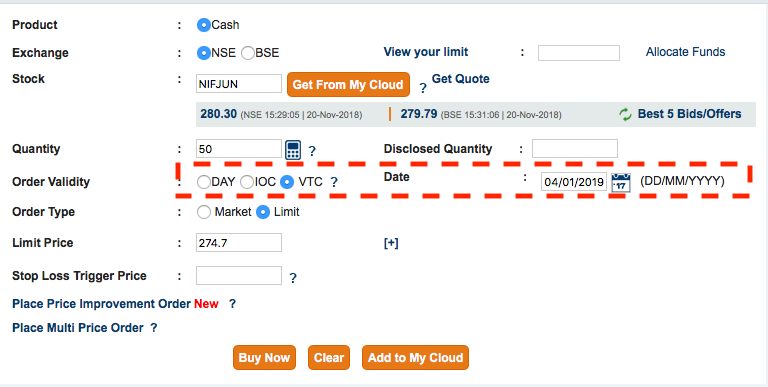
ICICIDirect VTC buy
Step 3:
Now wait for the price to be met in the next ‘X’ number of days, default is 45 days i think.
Let us do some back testing - assuming a purchase price of 2% discount to market price for March 2017 to Oct 2018 on NIFTY JR as of 1st of each month and compare that against a systematic investment of the same amount triggered by default on the 1st working day of each month.
You will see that the average price is 285.73 instead of 291.62 for the SEP (Systematic Equity Plan) for the same amount invested.
A few Big caveats
When you are in a bull market and there is no downward movement at all, your trades will not trigger at all.
In the above example there are several months during which this happened. (Apr, Jun, Jul 17 and Mar, Apr 18) The price condition was never met and the order never triggered for that month. So do take note of that when placing an order like this.
If you don’t have the patience to wait for your price trigger to happen, then this model is definitely not for you. This method needs patience and ability to control your impulse to constantly revise your price.
You might sneeze at this 2% discount, but this adds up a lot over a period of 15 to 20 years. Assume the return that you make is 12% CAGR without the 2% discount. Adding that into the mix, let us assume 14% CAGR (I know it doesn’t work like that, but for simplicity’s sake let us assume 2% added to CAGR)
Impressive - isn’t it?
What are your thoughts on this? Do you plan to implement something like this for your stock purchases? Leave your comments below.
Disclaimer : I am not a financial planner or fiduciary. Do not use this as trading advice. Research and invest at your own risk.
Subscribe to my RSS for new posts.